Note
Go to the end to download the full example code
Linear encoding model#
When it comes to fitting encoding models to fMRI data, the most common approach is to use a linear encoding model, were the predicted BOLD response is a linear combination of different neural populations with predefined tuning properties.
Here we explore such an approach.
# Import necessary libraries
from braincoder.models import VonMisesPRF
import numpy as np
import pandas as pd
import matplotlib.pyplot as plt

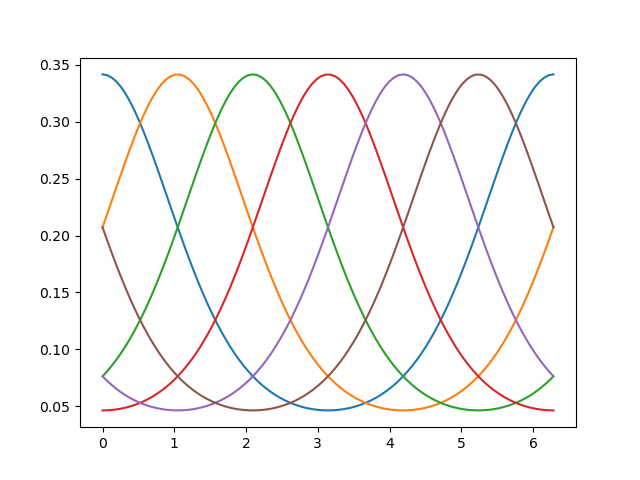
# Set up six evenly spaced von Mises PRFs
centers = np.linspace(0.0, 2*np.pi, 6, endpoint=False)
parameters = pd.DataFrame({'mu':centers, 'kappa':1., 'amplitude':1.0, 'baseline':0.0},
                          index=pd.Index([f'Voxel {i+1}' for i in range(6)], name='voxel'))

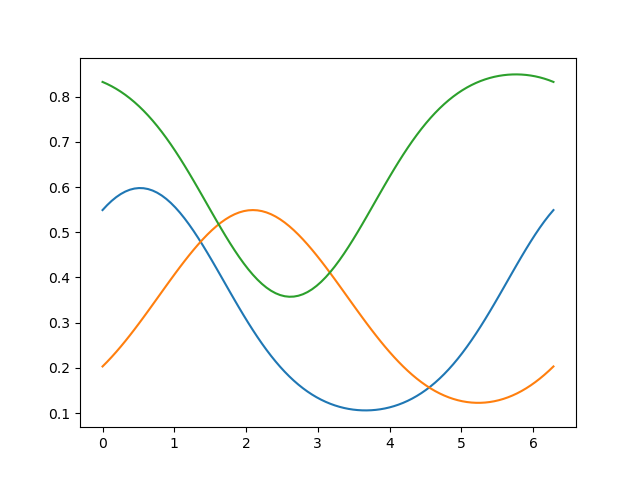
# We have 3 voxels, each with a linear combination of the 6 von Mises functions:
weights = np.array([[1, 0, 1],
                    [1, .5, 1],
                    [0, 1, 0],
                    [0, .5, 0],
                    [0, 0, 1],
                    [0, 0, 1]]).astype(np.float32)

model = VonMisesPRF(parameters=parameters, weights=weights)
# Plot the basis functions
# Note that the function `basis_functions` returns a `tensorflow` `Tensor`,
# which has to be converted to a numpy array:
orientations = np.linspace(0, np.pi*2, 100)
basis_responses = model.basis_predictions(orientations, parameters).numpy()

_ = plt.plot(orientations, basis_responses)

# Plot the predicted responses for the 3 voxels
# Each voxel timeseries is a weighted sum of the six basis functions
pred = model.predict(paradigm=orientations)
_ = plt.plot(orientations, pred)

# Import the weight fitter
from braincoder.optimize import WeightFitter
from braincoder.utils import get_rsq

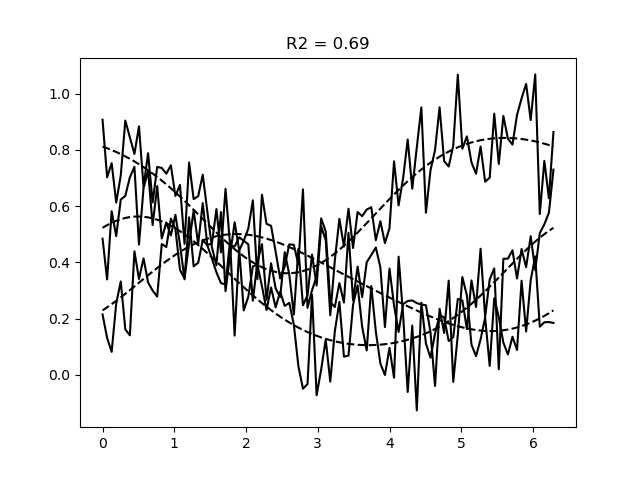
# Simulate data
data = model.simulate(paradigm=orientations, noise=0.1)

# Fit the weights
weight_fitter = WeightFitter(model, parameters, data, orientations)
estimated_weights = weight_fitter.fit(alpha=0.1)

# Get predictions for the fitted weights
pred = model.predict(paradigm=orientations, weights=estimated_weights)
r2 = get_rsq(data, pred)

# Plot the data and the predictions
plt.figure()
plt.plot(orientations, data, c='k')
plt.plot(orientations, pred.values, c='k', ls='--')
plt.title(f'R2 = {r2.mean():.2f}')
# %%

Text(0.5, 1.0, 'R2 = 0.69')
Total running time of the script: (1 minutes 7.599 seconds)