Note
Go to the end to download the full example code
Invert encoding model#
Here we invert different encoding models
import scipy.stats as ss
import matplotlib.pyplot as plt
import seaborn as sns
import numpy as np

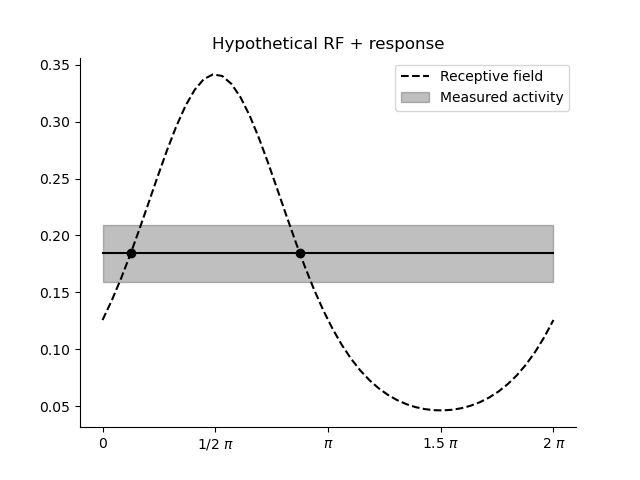
plt.title('Hypothetical RF + response')
x = np.linspace(0, 2*np.pi)
dist = ss.vonmises(loc=.5*np.pi, kappa=1.)

plt.plot(x, dist.pdf(x), c='k', ls='--', label='Receptive field')
y =dist.pdf(7./8.*np.pi)
plt.plot(x, np.ones_like(x)*y, c='k', ls='-')
plt.fill_between(x, y-0.025, y+0.025, alpha=.25, color='k', label='Measured activity')

plt.scatter(1./8.*np.pi, y, c='k')
plt.scatter(7./8.*np.pi, y, c='k')

plt.xticks([0.0, .5*np.pi, np.pi, 1.5*np.pi, 2*np.pi], ['0', '1/2 $\pi$', '$\pi$', '1.5 $\pi$', '2 $\pi$'])
sns.despine()

plt.legend()

<matplotlib.legend.Legend object at 0x2d92625c0>
# We set up a simple VonMisesPRF model
from braincoder.models import VonMisesPRF
import pandas as pd
import numpy as np

# Set up six evenly spaced von Mises PRFs
parameters = pd.DataFrame([{'mu':0.5*np.pi, 'kappa':1., 'amplitude':1.0, 'baseline':0.0}]).astype(np.float32)
weights = np.array([[1]]).astype(np.float32)

model = VonMisesPRF(parameters=parameters, weights=weights)
omega = np.array([[0.1]]).astype(np.float32)

data = pd.DataFrame([y]).astype(np.float32)
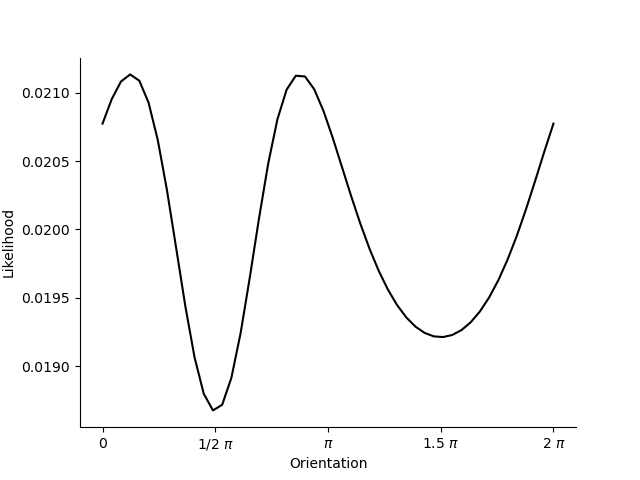
# Evaluate the likelihood of different possible orientations
orientations = np.linspace(0.0, 2*np.pi).astype(np.float32)
likelihood = model.likelihood(orientations, data, parameters, weights, omega)

# And plot it..
plt.figure()
plt.plot(orientations, likelihood.T, c='k')
plt.xticks([0.0, .5*np.pi, np.pi, 1.5*np.pi, 2*np.pi], ['0', '1/2 $\pi$', '$\pi$', '1.5 $\pi$', '2 $\pi$'])

sns.despine()
plt.xlabel('Orientation')
plt.ylabel('Likelihood')

Text(15.972222222222216, 0.5, 'Likelihood')
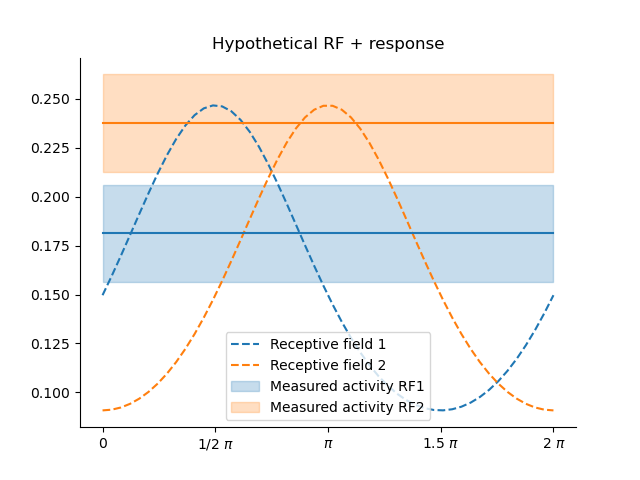
# Simulate two-RF model
palette = sns.color_palette()

plt.title('Hypothetical RF + response')
x = np.linspace(0, 2*np.pi)
dist1 = ss.vonmises(loc=.5*np.pi, kappa=.5)
dist2 = ss.vonmises(loc=1.*np.pi, kappa=.5)

plt.plot(x, dist1.pdf(x), ls='--', label='Receptive field 1', color=palette[0])
plt.plot(x, dist2.pdf(x), ls='--', label='Receptive field 2', color=palette[1])


y1 =dist1.pdf(7./8.*np.pi)
y2 =dist2.pdf(7./8.*np.pi)

plt.plot(x, np.ones_like(x)*y1, c=palette[0], ls='-')
plt.plot(x, np.ones_like(x)*y2, c=palette[1], ls='-')

plt.fill_between(x, y1-0.025, y1+0.025, alpha=.25, color=palette[0], label='Measured activity RF1')
plt.fill_between(x, y2-0.025, y2+0.025, alpha=.25, color=palette[1], label='Measured activity RF2')

plt.xticks([0.0, .5*np.pi, np.pi, 1.5*np.pi, 2*np.pi], ['0', '1/2 $\pi$', '$\pi$', '1.5 $\pi$', '2 $\pi$'])
sns.despine()
plt.legend()

<matplotlib.legend.Legend object at 0x2ce5a0940>
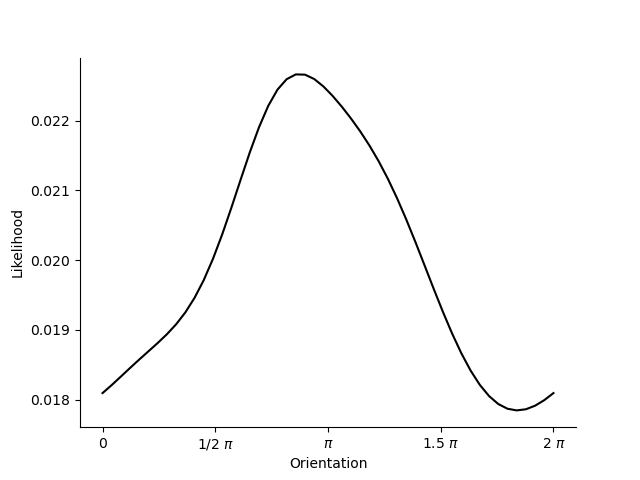
# Set up 2-dimensional model to invert
parameters = pd.DataFrame([{'mu':0.5*np.pi, 'kappa':.5, 'amplitude':1.0, 'baseline':0.0},
                           {'mu':1.*np.pi, 'kappa':.5, 'amplitude':1.0, 'baseline':0.0}]).astype(np.float32)

model = VonMisesPRF(parameters=parameters)
omega = np.array([[0.05, 0.0], [0.0, 0.05]]).astype(np.float32)

dist1 = ss.vonmises(loc=.5*np.pi, kappa=.5)
dist2 = ss.vonmises(loc=1.*np.pi, kappa=.5)
x = 7./8.*np.pi
y1 =dist1.pdf(x)
y2 =dist2.pdf(x)

data = pd.DataFrame([[y1, y2]]).astype(np.float32)

likelihood = model.likelihood(orientations, data, parameters, None, omega)

plt.plot(orientations, likelihood.T, c='k')
plt.xticks([0.0, .5*np.pi, np.pi, 1.5*np.pi, 2*np.pi], ['0', '1/2 $\pi$', '$\pi$', '1.5 $\pi$', '2 $\pi$'])

sns.despine()
plt.xlabel('Orientation')
plt.ylabel('Likelihood')
# %%

Text(24.847222222222214, 0.5, 'Likelihood')
Total running time of the script: (0 minutes 0.531 seconds)