Note
Go to the end to download the full example code
Create a simple Gaussian Prf encoding model#
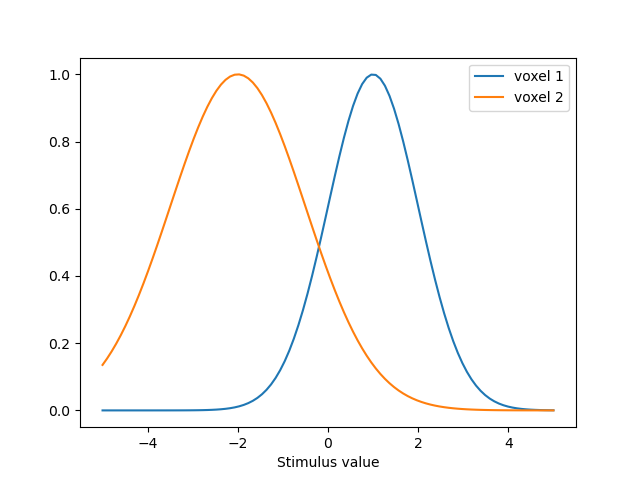
In this example, we create a Gaussian PRF model and plot the predictions. We also simulate data and then estimate back the generating parameters.
# Import necessary libraries
from braincoder.models import GaussianPRF
import pandas as pd
import numpy as np

# We set up two PRFS, one centered at 1 and one centered at -2
# The first one has a sd of 1 and the second one has a sd of 1.5
parameters = [{'mu':1.0, 'sd':1.0, 'amplitude':1.0, 'baseline':0.0},
              {'mu':-2., 'sd':1.5, 'amplitude':1.0, 'baseline':0.0}
              ]
parameters = pd.DataFrame(parameters, index=['voxel 1', 'voxel 2'])

# We have a virtual experimental paradigm where we go from -5 to 5
paradigm = np.linspace(-5, 5, 100)

# Set up the model.
model = GaussianPRF(paradigm=paradigm, parameters=parameters)

# Extract and plot the predictions
predictions = model.predict()
predictions.index = pd.Index(paradigm, name='Stimulus value')
ax = predictions.plot()

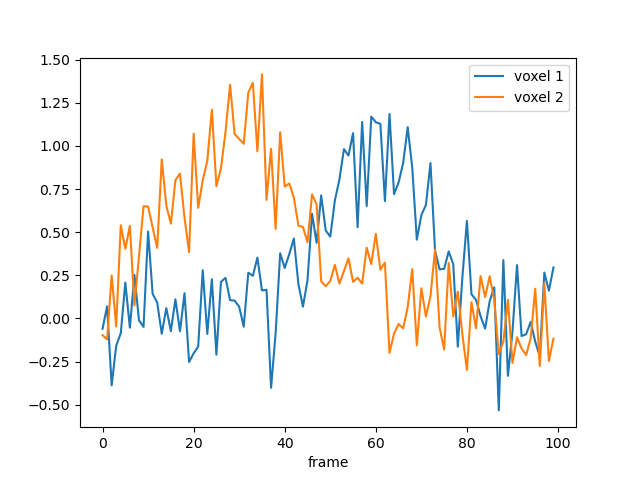
# We simulate data with a bit of noise
data = model.simulate(noise=0.2)
data.plot()

<Axes: xlabel='frame'>
# Import and set up a parameter fitter with the (simulated) data,
# the paradigm, and the model
from braincoder.optimize import ParameterFitter
from braincoder.utils import get_rsq

optimizer = ParameterFitter(model, data=data, paradigm=paradigm)

# Set up a grid search over the parameters
possible_mus = np.linspace(-5, 5, 10)
possible_sds = np.linspace(0.1, 5, 10)

# For the grid search we use a correlation cost function, so we can fit
# the amplitude an baseline later using OLS
possible_amplitudes = [1.0]
possible_baselines = [0.0]

# Fit the grid
grid_pars = optimizer.fit_grid(possible_mus, possible_sds, possible_amplitudes, possible_baselines, use_correlation_cost=True, progressbar=False)

# Show the results
grid_pars
Working with chunk size of 3333333
Using correlation cost!

  0%|          | 0/1 [00:00<?, ?it/s]
100%|██████████| 1/1 [00:00<00:00, 11.42it/s]
# We can now fit the amplitude and baseline using OLS
grid_pars = optimizer.refine_baseline_and_amplitude(grid_pars)

# Show the fitted timeseries
import matplotlib.pyplot as plt
import seaborn as sns
palette = sns.color_palette()
grid_pred = model.predict(parameters=grid_pars)

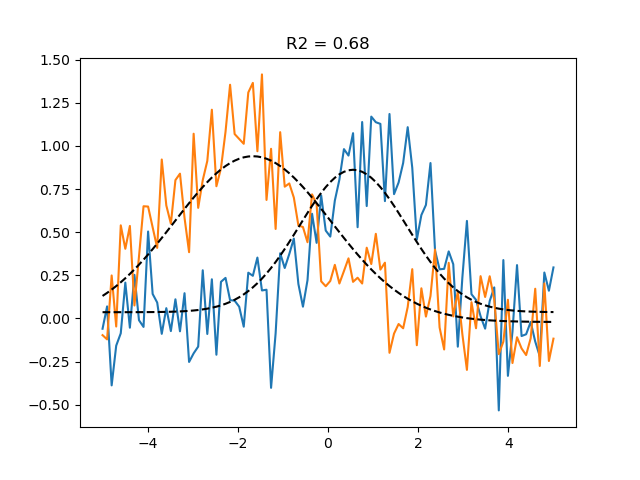
# See how well the predictions align with the data
# using the explained variance statistic
r2_grid = get_rsq(data, grid_pred)

plt.plot(paradigm, data)
plt.plot(paradigm, grid_pred, ls='--', c='k', label='Grid prediction')
plt.title(f'R2 = {r2_grid.mean():.2f}')

Text(0.5, 1.0, 'R2 = 0.68')
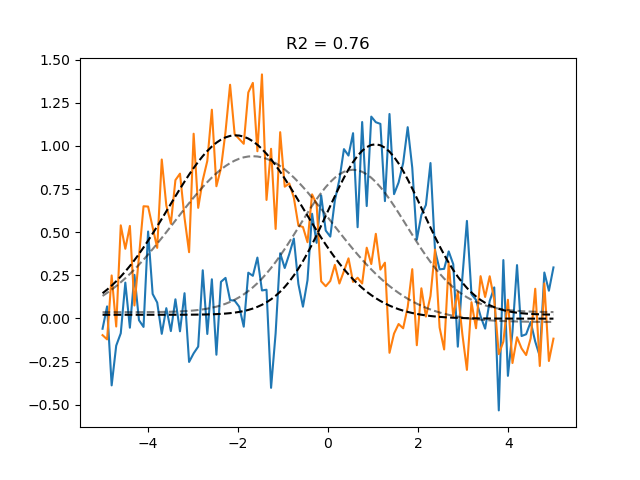
# Final optimisation using gradient descent:
gd_pars = optimizer.fit(init_pars=grid_pars, progressbar=False)
gd_pred = model.predict(parameters=gd_pars)

r2_gd = get_rsq(data, gd_pred)

plt.plot(paradigm, data)
plt.plot(paradigm, grid_pred, ls='--', c='k', alpha=0.5, label='Grid prediction')
plt.plot(paradigm, gd_pred, ls='--', c='k', label='Gradient descent prediction')
plt.title(f'R2 = {r2_gd.mean():.2f}')

Number of problematic voxels (mask): 0
Number of voxels remaining (mask): 2

Text(0.5, 1.0, 'R2 = 0.76')
Total running time of the script: (0 minutes 6.255 seconds)